Not Just Ad Spend: How to Calculate the Real Cost of Running a Media Buying Team
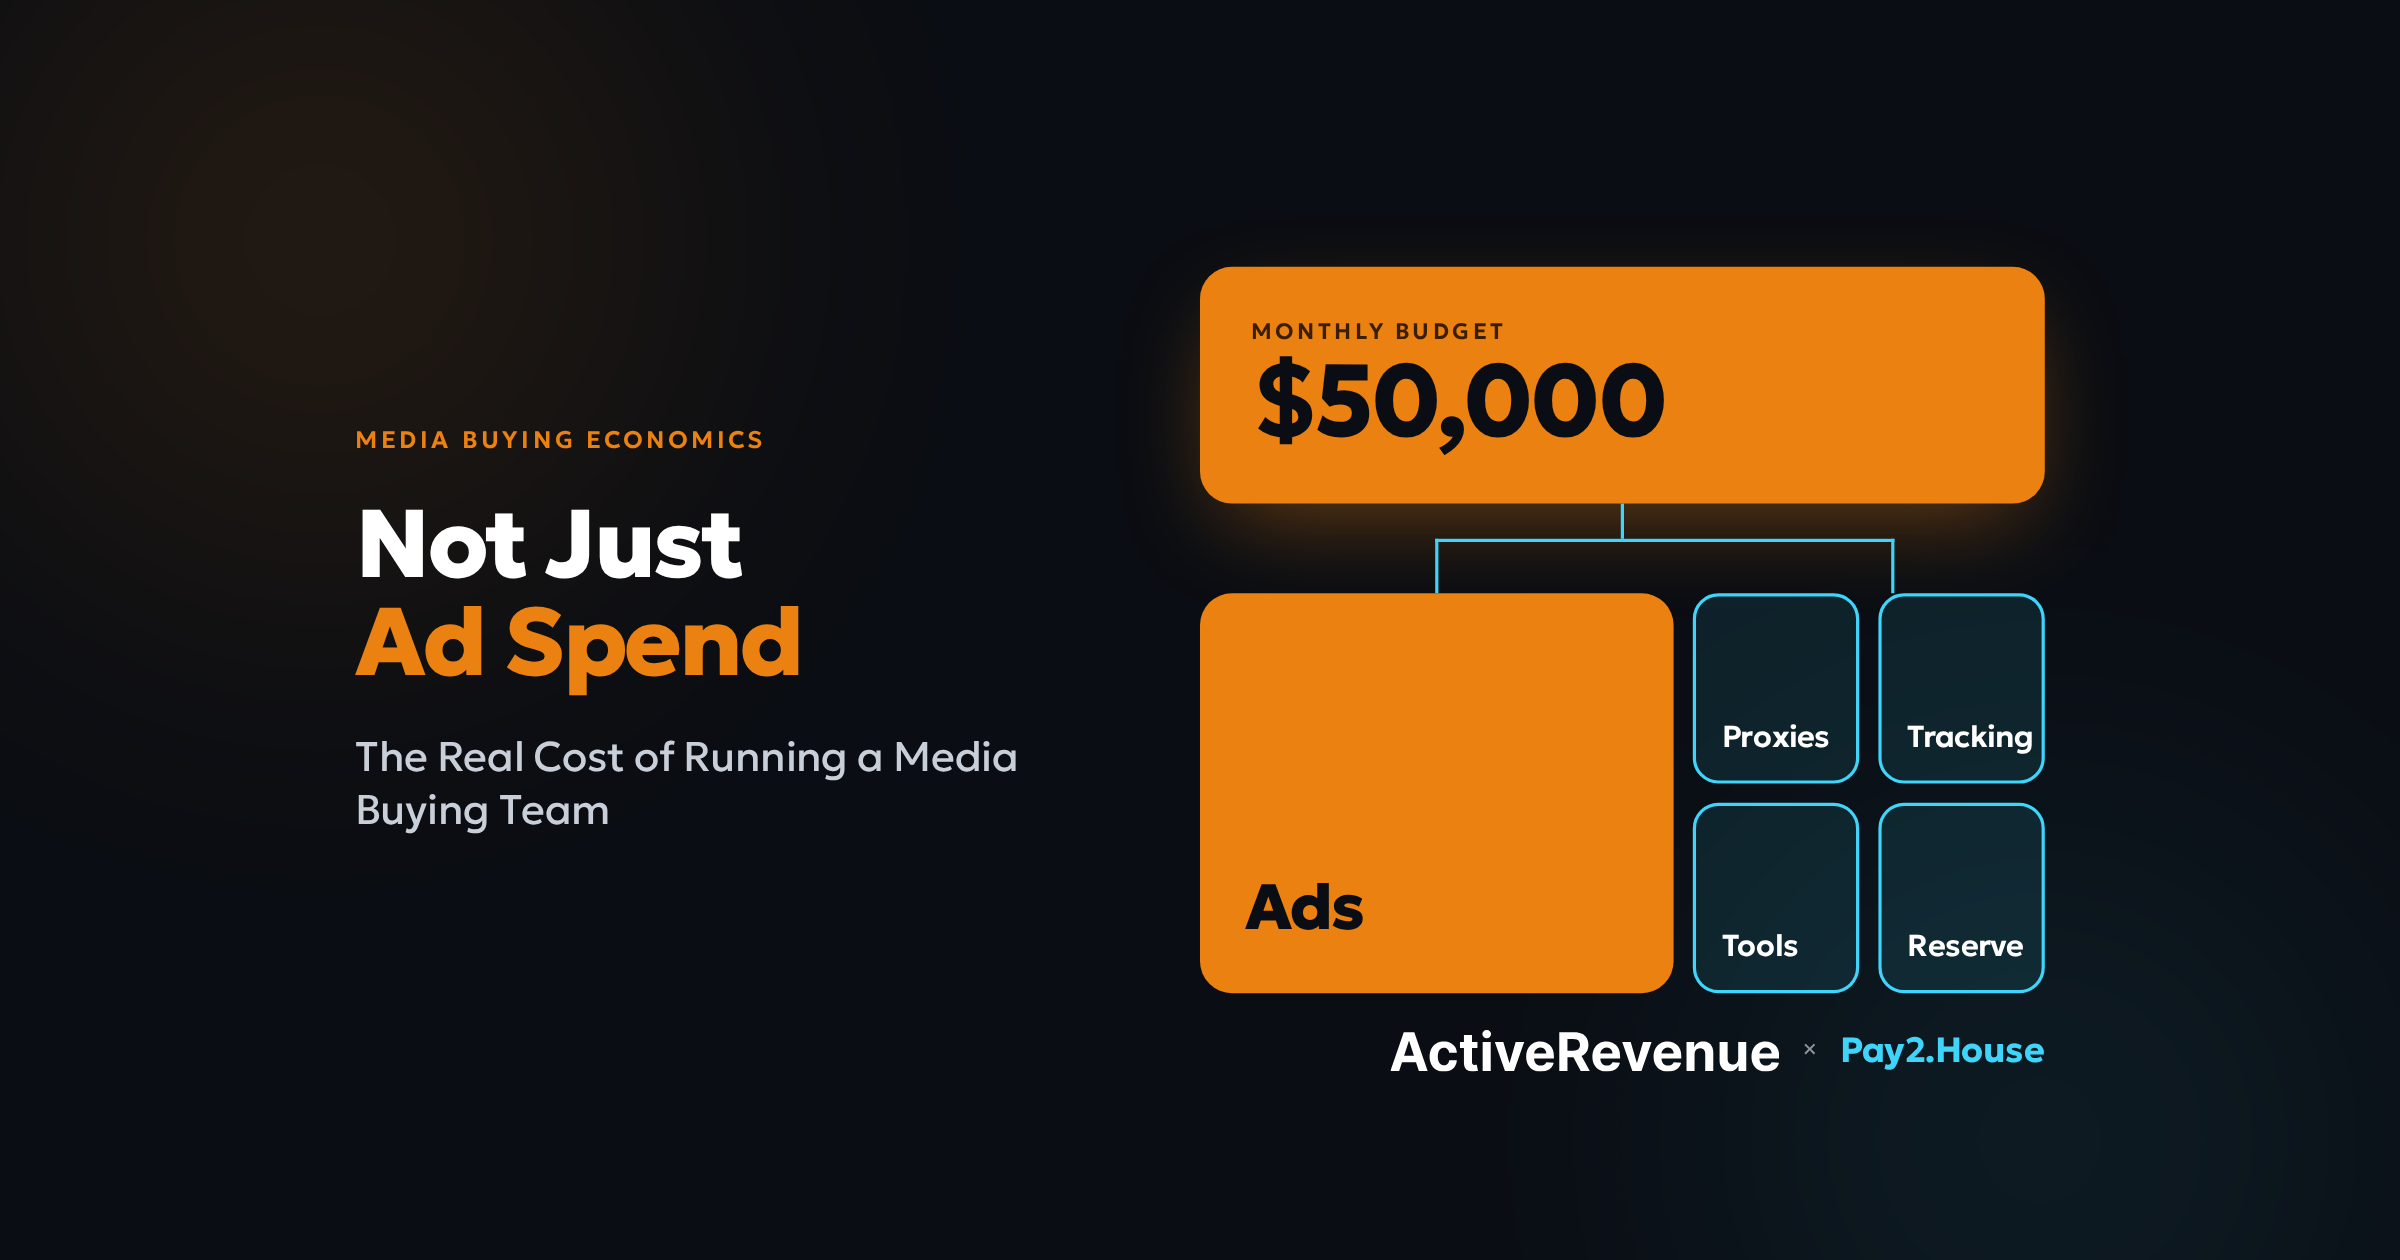
A $50,000 budget does not mean $50,000 in ad spend. Using a four-buyer team as an example, let's break down how to allocate the budget between traffic, work tools, and a reserve, and then calculate how much the traffic acquisition actually cost.
When there is one buyer and one traffic source on the team, expenses can still be tracked manually. Once multiple GEOs, ad platforms, proxies, trackers, AI services, and subscriptions come into play, the question "How much did we spend on advertising?" no longer gives you the full picture.
To manage the budget properly, you need to see two things: how much money went directly into traffic and how much the infrastructure supporting that traffic acquisition cost.
Let's break it down using one scenario.
Step 1. Split the Total Budget
Let's say a team of four buyers has a monthly budget of $50,000.
Sending the entire amount to traffic sources is not the best approach. Part of the budget will be needed for proxies, analytics, creative tools, infrastructure, and other operating expenses.
| Category | Planned | Budget Share |
|---|---|---|
| Advertising and traffic acquisition | $42,000 | 84% |
| Proxies and accounts | $2,000 | 4% |
| Analytics and tracking | $1,500 | 3% |
| AI and creative tools | $1,000 | 2% |
| Hosting, domains, and infrastructure | $1,000 | 2% |
| Reserve | $2,500 | 5% |
| Total | $50,000 | 100% |
This is an example structure, not a universal ratio for every team.
Here, $42,000 is the advertising budget, $5,500 covers operating expenses, and $2,500 is the reserve. Until the reserve is actually spent, it should not be counted as an actual expense.
There is another important point. If a buyer spends $10,000 on traffic and an additional $400 on tools used specifically for their work, the actual cost of that direction is $10,400.
At the same time, shared team expenses should not be artificially assigned to a specific buyer. If one tracker is used by all four people, it is better to record it separately as a Team Expense.
Step 2. Allocate the Advertising Budget
From the $42,000 advertising budget, let's allocate funds to the four buyers and create a separate testing fund:
| Direction | Monthly Budget |
|---|---|
| Buyer 01 | $10,000 |
| Buyer 02 | $10,000 |
| Buyer 03 | $9,000 |
| Buyer 04 | $9,000 |
| New hypothesis testing | $4,000 |
| Total advertising budget | $42,000 |
Keeping a separate testing budget is important: new GEOs and traffic sources should not quietly eat into the limits of active campaigns.
Now imagine Buyer 01 allocates their $10,000 as follows:
- $5,000 for the US;
- $3,000 for the UK;
- $2,000 for testing a new GEO.
If the buyer uses multiple traffic sources, it is worth tracking those as well. For example, ActiveRevenue can be one of the traffic sources used for testing. The platform operates on a self-serve model and provides targeting and campaign statistics tools, so in our model, the related expenses belong to the advertising budget.
This makes it possible to compare not only spending by GEO, but also, for example, how much was spent on the US through a specific source and what results the corresponding campaigns generated.
Step 3. Link Every Expense to a Clear Purpose
You do not need a spreadsheet with a hundred columns. To start, it is enough to track six parameters:
- responsible person — buyer, team, or another budget owner;
- category — advertising, proxies, analytics, infrastructure, etc.;
- purpose — what the payment was for;
- GEO and source — if they can actually be identified;
- planned — how much was expected to be spent;
- actual — how much was spent.
For example:
Buyer 01 → advertising → ActiveRevenue → US → planned $1,500 → actual $1,420
Or:
Team → analytics → shared expense → planned $500 → actual $520
In the second case, there is no reason to split the $520 between four buyers just to make sure every row has an individual owner. If a tool is used by the entire team, it should remain a team-wide expense.
This gives you two different metrics:
Advertising spend — how much was spent directly on traffic acquisition.
Operating expenses — how much the tools and infrastructure required for the work cost.
You can analyze them together, but they should not be mixed into one category.
Where Pay2.House Fits Into This Structure
Once there are a lot of payments, the problem is no longer limited to the spreadsheet. Confusion starts at the payment-instrument level as well.
For example, one card is used for Buyer 01's advertising, then the same card pays for a proxy, and later a work-service subscription is charged to it. A month later, you have to reconstruct which expense belonged to which purpose based on a single statement.
A clearer approach is to separate payment instruments by purpose.
For example:
Card 01 → Buyer 01 → advertising expenses
Card 02 → Buyer 02 → advertising expenses
Card 03 → Team → shared services
This structure can be organized using virtual cards in Pay2.House, while the My Teams section can be used to work with team members, cards, and team expenses. The service allows users to add members, allocate cards and budgets, and track transactions across accounts and cards.
This does not replace a tracker or BI system. A card does not know whether a campaign was profitable or which GEO performed better. Its role is much more specific: to help organize the payment flow so that each transaction can be matched more easily to the responsible person and its purpose.
BINs Are Also Part of Budget Planning
For media buying teams, it is not only the availability of a virtual card that matters, but also choosing the right BIN for a specific task.
Pay2.House offers virtual cards with BINs from different countries, including Estonia, Hong Kong, Singapore, Canada, the US, and the UK. The service's team cards page lists more than 50 available BINs.
Therefore, when planning expenses, a team can account not only for the top-up amount, but also for the cost of issuing the required cards and choose an appropriate option for a specific service.
For example, if a new project requires separate cards for advertising, SaaS, and infrastructure, the cost of issuing those cards should be included in the operating budget in advance rather than treated as an unexpected expense after the launch.
At the same time, the specific BIN and whether a particular service accepts the card should be checked before issuance, as availability depends on the selected card and the service itself. Pay2.House separately provides information about available BINs and card options for different online services.
For a team, this means one simple thing: payment infrastructure should also be part of the budget rather than remain outside it.
Step 4. Compare Plan vs. Actual Every Week
There is no need to wait until the end of the month to discover overspending.
Let's say the team planned $10,000 for the first week of the advertising budget: $9,500 was allocated between the buyers, while $500 was reserved for testing.
| Direction | Weekly Plan | Actual | Variance |
|---|---|---|---|
| Buyer 01 | $2,500 | $2,300 | $200 remaining |
| Buyer 02 | $2,500 | $2,700 | $200 over |
| Buyer 03 | $2,250 | $2,000 | $250 remaining |
| Buyer 04 | $2,250 | $2,200 | $50 remaining |
| Buyers — total | $9,500 | $9,200 | $300 remaining |
The $500 testing budget is not included in this table. It is better to track it separately so that the planned testing budget is not mixed with the limits of active campaigns.
As a result, the team can immediately see two things: the buyers' total weekly budget is $300 under plan, while Buyer 02 has already exceeded their individual limit.
The variance itself does not indicate whether the buyer performed well or poorly. The overspend may have been approved due to campaign scaling. Financial reconciliation simply shows where the team needs to investigate the reasons and compare spending with advertising results.
Track More Than Spend: Track the Cost of the Process
In our example, the team has $50,000 available, but only $42,000 is allocated directly to advertising.
Another $5,500 supports the infrastructure, while $2,500 remains in reserve.
This simple split helps avoid one of the common mistakes: measuring team efficiency only through the ad account and overlooking the expenses that occur around traffic acquisition.
The practical model looks like this:
Total budget → advertising budget + operating expenses + reserve.
Then:
Advertising budget → buyer → GEO/source → campaign.
And for every expense:
responsible person → purpose → category → plan → actual.
If an expense applies to the entire team, there is no need to artificially distribute it between buyers. If it belongs to a specific GEO or source, it can be recorded separately.
As a result, the manager can see not only how much money went into advertising, but also how much the entire operational side that enabled the advertising to run actually cost.
This structure becomes especially important as the team grows: the more buyers, GEOs, and traffic sources you have, the more costly the lack of clear financial tracking becomes.
Ready to add a new traffic source to your testing budget? Create a free ActiveRevenue account and launch push, popunder, and zero-click campaigns across 248+ GEOs.